

Key SaaS Metrics For Startup
What are Saas Metrics?
SaaS metrics are key performance indicators (KPIs) specific to SaaS businesses. These metrics allow startups to track and analyze critical aspects of their business, such as user acquisition, engagement, and revenue generation. By monitoring SaaS metrics regularly, startups can make data-driven decisions that help them optimize performance and achieve long-term success.
Here are the 10 most important metrics that every SaaS startup should keep track of:
1. Monthly Recurring Revenue
2. Customer Acquisition Cost
3. Churn Rate
4. Lifetime Value
5. Gross Margin
6. Monthly Active Users
7. Average Revenue per User
8. Customer Lifetime Value to Customer Acquisition Cost Ratio
9. Net Promoter Score
10. Viral Coefficient
Monthly Recurring Revenue (MRR)
MRR is the most critical metric for any SaaS business, and it measures the predictable revenue a company expects to earn every month. MRR is calculated by multiplying the total number of customers by the average monthly payment per customer.
Let’s take an example. If you have 100 paying customers, and each customer pays $100 monthly, your MRR would be $10,000.
Customer Acquisition Cost (CAC)
The CAC stands for customer acquisition cost, and this measure is crucial because it enables you to assess how well your marketing and sales initiatives work. By dividing the entire cost of sales and marketing by the number of new customers obtained, CAC is computed.
For instance, your CAC would be $100 if you invested $10,000 in sales and marketing and added 100 new clients.
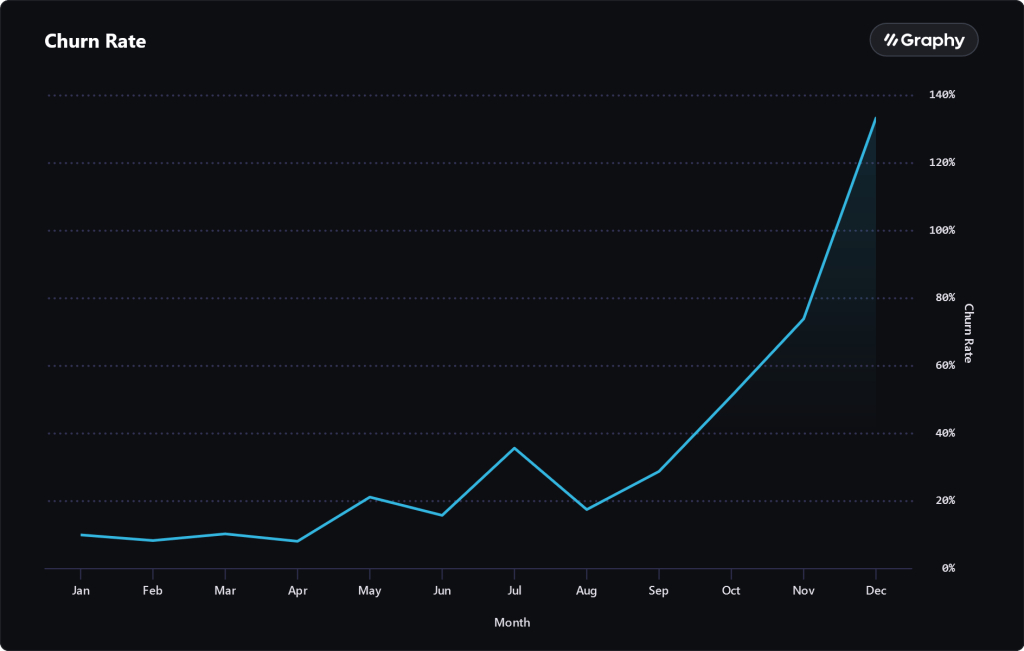
Churn Rate
The churn rate, also known as the rate of attrition or customer churn, measures the proportion of customers who cancel or do not renew their contracts. This indicator is crucial because it enables you to identify the causes of customer turnover and take the appropriate steps to lower it. The churn rate is determined by dividing the total number of customers at the start of a given time period by the number of customers actually retained throughout that period. Your customer turnover rate would be 10%, for instance, if you started the month with 100 clients and lost 10.
Lifetime Value (LTV)
The entire income you may anticipate from a single client throughout their subscription is called lifetime value (LTV). This statistic is crucial since it enables you to assess your company’s profitability and your marketing and sales initiatives’ return on investment (ROI). The average monthly income per customer is multiplied by the typical customer lifespan to determine LTV. Example: The LTV would be $1,200 if the average customer lifespan is 12 months and the average monthly income per client is $100.
Gross Margins
Gross margins are a way to gauge how profitable your company is. Because it enables you to calculate the cost of items sold and the income from those things, this statistic is crucial. When calculating gross margins, income is reduced by the cost of items sold, and the resulting amount is divided by the payment.
For instance, your startup’s gross margin would be 60% if its revenue was $10,000 and its cost of goods sold was $4,000.
Monthly Active Users (MAU)
MAU measures the number of unique users who engage with your product or service monthly. This metric is crucial because it helps you understand your customers’ engagement level and your business’s growth potential. MAU is calculated by counting the unique users interacting with your product or service during a specific month.
Average Revenue Per User (ARPU)
The average monthly revenue earned per user, or ARPU is measured. This indicator is crucial since it clarifies your company’s income potential and each client’s profitability. ARPU is determined by dividing the entire income earned by the total number of users.
Your ARPU would be $100, for instance, if 100 users contributed $10,000 in revenue.
LTV to CAC Ratio
The Customer Lifetime Value to Customer Acquisition Cost Ratio (LTV: CAC) calculates the difference between a customer’s lifetime value and acquisition cost. This statistic is crucial because it enables you to calculate the return on investment for your marketing and sales operations. LTV: CAC ratio can be calculated by dividing client lifetime value by customer acquisition cost.
For example, if the LTV of a customer is $1,200 and the CAC is $100, then the LTV: CAC ratio would be 12:1.
Net Promoter Score (NPS)
NPS gauges a customer’s propensity to endorse your good or service to others. This indicator is crucial because it gives insight into client satisfaction and the possibility of word-of-mouth advertising. The net promoter score is determined by dividing the proportion of promoters (customers who would suggest your product or service) by the percentage of detractors (customers who would not recommend your product or service)
Viral Coefficient
The viral coefficient gauges the potential for word-of-mouth advertising to expand your company. This statistic is crucial since it clarifies your product or service’s performance and its capacity for exponential expansion. The viral coefficient is determined by dividing the number of invitations each user sends by their conversion rate.
How to Measure and Analyze SaaS Performance?
Once you’ve identified the key SaaS metrics you want to track, the next step is to measure and analyze them effectively.
One of the most effective ways to measure SaaS performance is to use a combination of analytics tools and data visualization software. These tools can help you gather data from various sources and display it in an easy-to-understand format that provides valuable insights into your business’s overall performance
How to Track and Interpret SaaS Metrics
Tracking SaaS metrics involves more than just collecting data; startups must also be able to interpret the data to make meaningful decisions about their business. Here are a few tips for tracking and analyzing SaaS metrics effectively:
- Set clear goals and benchmarks to measure success.
- Regularly review and update your metrics based on changes to your business.
- Visualize your data to identify trends and patterns quickly.
- Compare your metrics to industry benchmarks to understand how well your business performs compared to your competitors.
SaaS Metric companies
Many companies specialize in SaaS metrics, offering software tools and consultancy services to help startups track and analyze their performance. Some of the most popular SaaS metric companies include:
The Benefits of Tracking SaaS Metrics for Startups
While tracking SaaS metrics may seem overwhelming, the benefits for startups are significant. By monitoring key metrics like MRR, churn, and customer engagement regularly, startups can:
- Make data-driven decisions that optimize performance and increase revenue
- Identify areas for improvement and drive innovation.
- Track progress towards specific goals and benchmarks.
- Ensure their business is financially viable over the long term.
Optimizing SaaS Performance with Metrics
Tracking and analyzing metrics can be a game-changer for SaaS startups. By understanding the essential metrics and how to track and analyze them effectively, founders can make data-driven decisions that optimize performance and increase their chances of long-term success.
While tracking and interpreting these metrics may seem daunting at first, it’s essential for building a successful SaaS business. By staying on top of key metrics and tracking progress regularly, startups can stay ahead of the competition and achieve their goals.
SaaS Metrics Calculator
Try our SaaS metrics calculator and get actionable insights into your performance.
FAQ
1. Is my SaaS business financially viable?
To check this, founders must thoroughly analyze their business’s financial data, including revenue, expenses, and cash flow. By closely monitoring key financial metrics like MRR, LTV, and gross margin, founders can make data-driven decisions that help them achieve sustainable growth and profitability.
2. What is the golden rule of SaaS?
The Rule of 40 states that a software company’s combined revenue growth rate and profit margin should equal or exceed 40%. SaaS companies above 40% generate profit sustainably, whereas companies below 40% may face cash flow or liquidity issues.
3. What is a KPI in SaaS?
A key performance indicator (KPI) is a quantifiable figure that shows how well a business accomplishes its primary goals. For example, the Customer Churn Rate, Net Promoter Score, and Customer Retention Rate are three KPIs most SaaS businesses use.
4. Difference between SaaS Metrics and SaaS KPIs
While the terms SaaS metrics and KPIs are often used interchangeably, there is a clear difference between the two. SaaS metrics are specific performance measures unique to SaaS businesses, while KPIs are broader measures of success that can be applied to any business.
4. Which Saas Metrics are the most important?
While the most critical SaaS metrics will vary depending on their goals, the most important are Monthly Recurring Revenue (MRR), Customer Acquisition Cost (CAC), Customer Lifetime Value (CLTV), Churn Rate, and Gross Margins.
7. What is the Rule of 40 in SaaS?
In recent years, the 40% rule has gained widespread usage as a popularized measure of growth by SaaS investors. The Rule of 40 states that if a company’s revenue growth rate were to be added to its profit margin, the total should exceed 40%.
Next: Looking for startup inspiration? Check out our latest blog on must-read startup books in 2023!